MAPPING PROJECTS
 |
 |
 |
 |
 |
|||||||||||
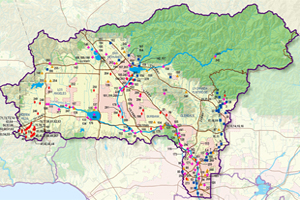
| IRWMP - Integrated Regional Water Management Plan |
|
|||
|
|
||||
| Los Angeles County, CA In order to deal with long term water supply and water quality issues in the Greater Los Angeles County Region - an area representing approximately nine million people and over 2,200 square miles - local agencies, organizations, cities, and county government are working together to develop an Integrated Regional Water Management Plan (IRWMP) for the Region. Duvivier Architects worked as a consultants to the prime, Brown and Caldwell, to produce all the maps for the final document and the workshops. Duvivier Architects also produced the Open Space requirements. |
 slide show (click picture) |
|
||
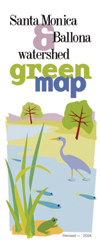
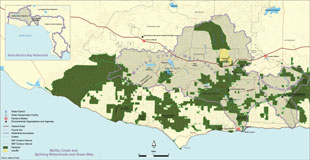
| Ballona Watershed Green Map |
|
|||
|
|
||||
|
Santa Monica, CA The Ballona
Watershed Green Map displays ecological and cultural resources found
throughout the Ballona Watershed. This includes important waterways,
wildlife migration routes, wetlands, public lands, alternative transportation
corridors, environmental organizations and green businesses. |
|
Click on the map to view full size
|
||
|
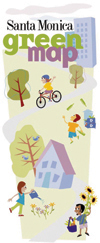
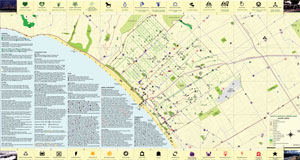
Santa Monica Green Map |
|
|||
|
|
||||
| Santa
Monica, CA The
Santa Monica Green Map shows green businesses as well as ecological
features. This map has been created to help residents and visitors
to the region become aware of the abundance of resources that contribute
to the making of a more sustainable community. The map will allow
users to visualize the breadth and diversity of the local environmental
resources and opportunities. On this map one finds features such
as: Development of the Green Map was funded by the City of Santa Monica's Environmental Programs Division (EPD) for use as an environmental education tool for residents, visitors, students and other community stakeholders. With the Green Map, the EPD hopes to stimulate discussion and ultimately inspire and promote a wide variety of sustainable practices such as reductions in energy use, water use and waste generation, use of environmentally friendly transportation options, purchase of environmentally friendly goods and services, and increased consumption of regional and organic foods. In addition, the Map will be used by Santa Monica teachers to help educate students about a variety of ecological issues in the watershed including water quality and conservation, the habitat needs of animals and plants, the impact of non-native species, the consequences of sprawl, the impact of consumer choices on the natural and built environment, and the interconnectedness of our actions and policy decisions. Development and data collection for the Green Map involved input from a variety of stakeholders throughout the watershed. The map makers worked with the Santa Monica High School Biology Department and Wildlife Club, the West LA chapter of the Audubon Society, the Santa Monica College Geo-Club, and many remarkable naturalists and business leaders. Not only were the encounters educational and fun (bird watching by sea kayak, wild edible plant gathering), they have spurred on new projects (including a new native plant garden at Santa Monica College) and brought different groups together who may not normally meet. |
|
Click on the map to view full size |
||
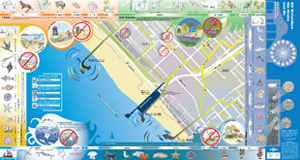
| Kids' Santa Monica Pier Green Map |
|
||||||||||||||||||||||||||||||||||||||||||||||||||||||||||||||||||||||||||||||
|
|
|||||||||||||||||||||||||||||||||||||||||||||||||||||||||||||||||||||||||||||||
| Santa
Monica, CA My Watershed, the Ocean and Me - Kid’s Green Map includes downtown Santa Monica, the Santa Monica Pier and adjacent Santa Monica Bay. The purpose of the map is to show the marine aquatic life found under and around the pier and adjacent beaches. It also illustrates the impact of pollution from activities on the pier and downtown. The habitat communities found under or near the pier include the: - beach. Information about the creatures which live in the above habitat communities is located on this map such as: - Arthropoda: crabs, lobster;
shrimp. These habitats suffer a number of problems including water quality impairments, public health issues and marine life degradation associated with human behavior on land. This Green Map aims to support long-term water quality protection, pollution prevention and marine habitat protection and restoration by addressing a major cause of environmental degradation: lack of public awareness/concern. The map focuses attention on a variety of critical resource issues including understanding ocean life, coastal water quality and public health, polluted storm-water runoff and illegal dumping, water conservation, the importance and biology of watersheds and a sense of belonging to a larger community with common environmental concerns. Development of the Green Map was partially funded by the City of Santa Monica's Environmental Programs Division (EPD) for use as an environmental education tool for residents, visitors, students and other community stakeholders. The Map is also used by Santa Monica teachers to help educate students about a variety of ecological issues in the watershed including water quality and conservation, the habitat needs of animals and plants, the impact of consumer choices on the natural and built environment, and the interconnectedness of our actions and policy decisions. Maps are available free of charge in libraries, bookstores, parks, tourist information offices and farmers’ markets. |
|
Critters
|
|||||||||||||||||||||||||||||||||||||||||||||||||||||||||||||||||||||||||||||


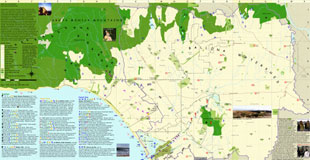
| Malibu Creek Green Map |
|
|||
|
|
||||
| Living
Lightly in Our Watershed |
|
|||
top
OTHER
PROJECTS
County of Mariposa GreenMap under development
Mariposa County, CA
Santa Monica GreenMap
2000
City of Santa Monica
Santa Monica, CA
Ballona Watershed GreenMap
2000
City of Santa Monica
Santa Monica, CA
top
projects: architecture | urban